
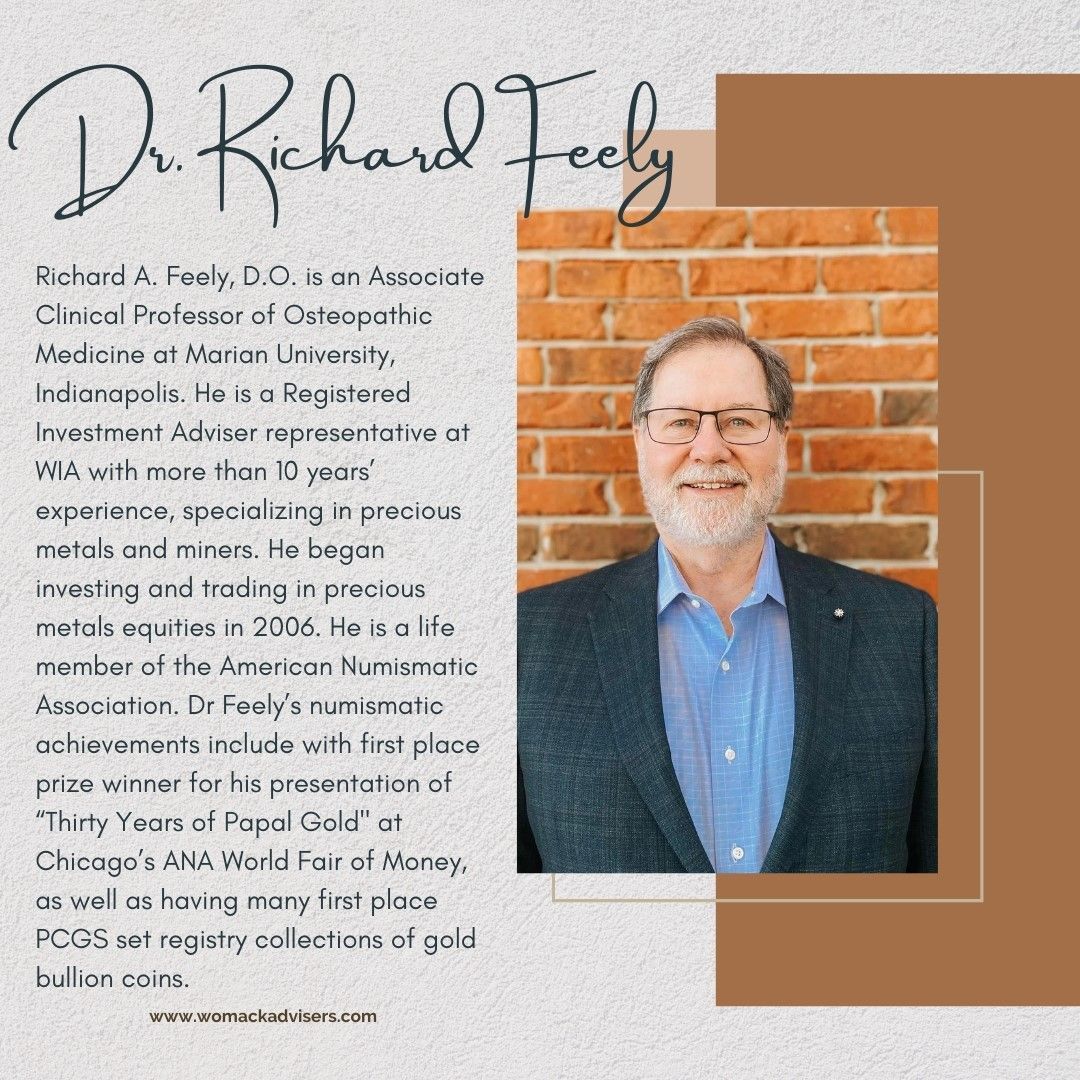
Precious Metals Forecast & Insights by Dr. Richard Feely
On April 30, 2024 - Gold (AU) close: $2,294.50 / Silver (AG)close: $26.32
Gold has advanced dramatically, up $373.57 or 18.7% in the last 2 months, from $1991.43 on Feb 13th, to $2365.00 on April 14th.
Silver advanced also in the same period; up $6.14 or 27.8%, $22.08 to $28.22.
Should you be invested in gold, silver, and/or miners? The stock market has normal rotations, trends, with advance, and declines. These are based upon a number of circumstances; interest rates, business economy, government spending, regulations, technical changes, as well as fear and greed. In big cycle moves/rotations, for precious metals gold has historically led the way, followed by silver and major miners then finally junior miners. We have just seen gold’s bull cycle begin.
Here are seven reasons UBS has recommended to investors why they should own mining stocks now:
- Geopolitical risks have central banks led by China are massively buying gold.
- Increasing US fiscal risk-excessive debt-investors moving into gold.
- Concerns about cryptocurrency replacing gold are no longer valid.
- Macroeconomic tailwinds for gold-TIPS yields a weakening US dollar.
- Gold has not yet returned to its historical high adjusted for inflation as 40% rise is needed.
- Overall investor positioning has not reflected the recent movement in gold prices.
- Gold stock valuation are low P/E 40% below normal levels, look for a 45% rise.
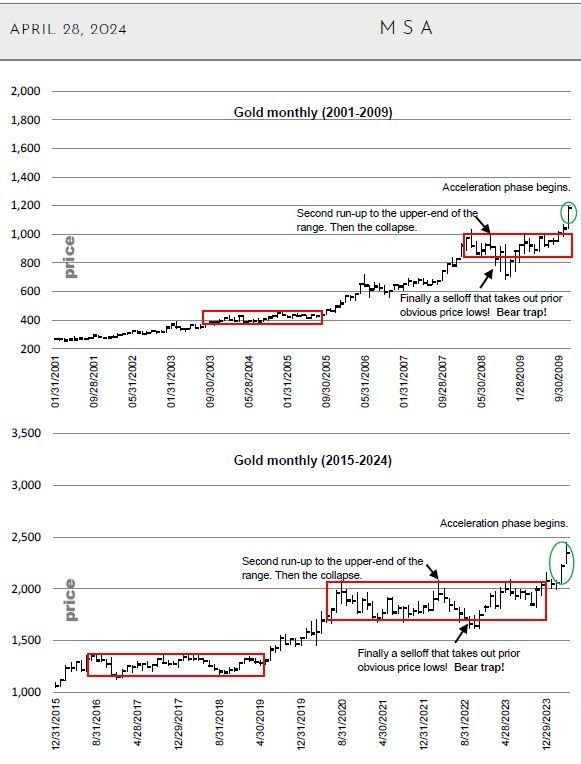
Gold’s last major bear market low was December 2015. This is the 9th year of annual momentum advance changing from daily up and down - arm wrestling. Now the gold price is moving into the acceleration phase from February to present.
What does market history tell us? During 2000-2011, precious metals bull market trend went vertically starting in 2010 (see chart below). In the 1979-1980 metals market both gold and silver went vertical with silver beating gold on a percentage basis. Below are the results of the 4 previous run-away advances in gold -
- 2008: 3/mo & 00 days - 32%
- 2007: 2/mo & 22 days - 32%
- 1979: 3/mo & 08 days - 31%
- 1978: 2/mo & 29 days - 31%
If we repeat these four previous runaways, gold will be $2618 +/- $20 during May.
Historically, silver vastly outperforms gold in the final year of the acceleration phase. Based upon historical analytical technical analysis of Elliott, Gann, and Oliver, gold and silver technical indicators point a significant advance in the next 12-18 months forming a bull run for gold, silver, and miners.
What are the market players doing? For the past four years small investors/traders have been disillusioned, selling their gold and silver metals as well as their ETFs into strength, while the Chinese and central governments of the BRICS and emerging market countries are buying gold hand over fist led by China and India. In January, the Chinese gold import from Switzerland alone was the highest ever: 120,000 kilograms (>4.2 million oz). China has added 18.5 tons since January, surpassing 2023 total purchases of 16.2 t leading to an all-time high of 822.1 t. The world’s total above ground gold ever produced is about 187,000 t. Meanwhile, the western investors/traders are chasing tech, AI or being forced to sell their precious metals to keep up with inflation. Currently, the investment in gold and silver is only 0.5% of the investment assets, which is a far cry from the 1960s when it was 2%. Markets cycles happen. The smart investor identifies them and invests in them early. The technical analysis/charts, fundamentals and geopolitical situation firmly indicates this is now the time for the gold cycle up move.
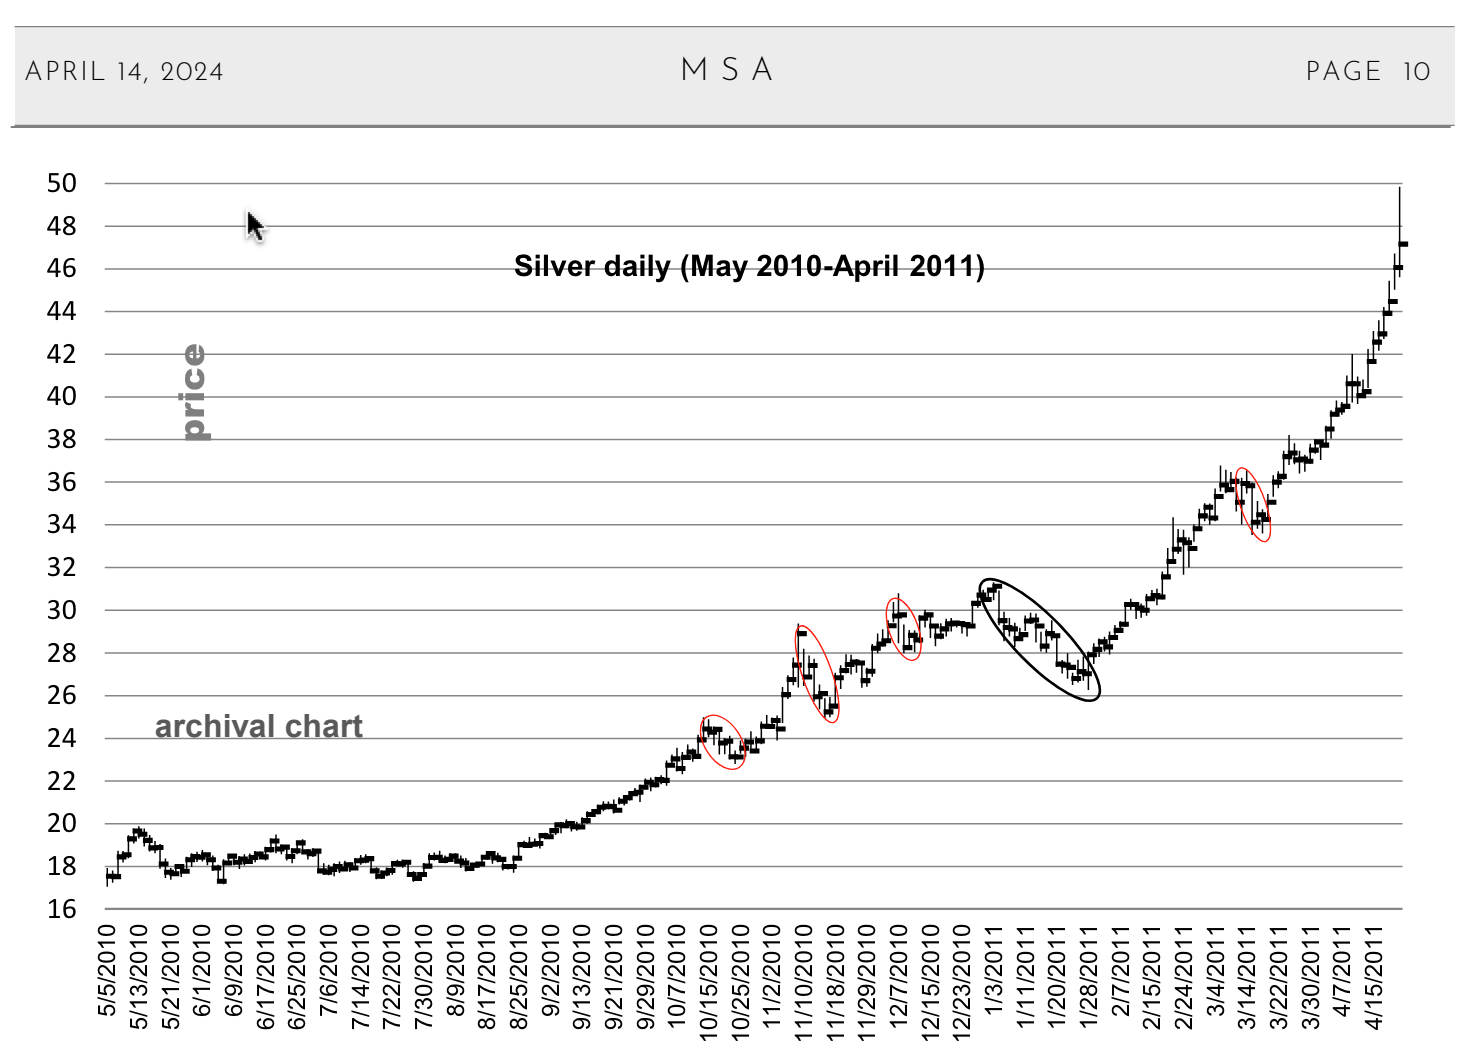
The chart below from Michael Oliver of Momentum Structural Analysis, shows the price of silver with 5 sell offs in 1 year. What we experienced on April 12, the selloff was minor just like October 15, 2010. We should expect more 1-6 day and at least one 15–28-day selloffs on the way up to $45-50/oz of silver. Historically, we saw in January 1979 thru January 1980 silver gained 646% ($6.70 to $50) while gold gained 270%.
Where do I see gold and silver going? Our current gold bull market started from December 2015 low of $1,040. Previous golden bull markets went up 6.5 - 8.0 times over several years. My long-term technical analysis based upon Elliott 5 waves up target number in gold is $7,890/oz. Silver historically is 2-2.5% of the price of gold. My long-term technical analysis Elliott 5 waves up target for silver is $167/oz.
Where will you make the most money from this golden bull rally? Here at Womack Investment Advisers, Inc (WIA), we believe that early in this rally gold, followed by silver will make the first two advances, followed by mining stocks. Based upon technical and fundamental analysis we see us just in the second inning of the game, with gold on first base, silver up to bat and miners on deck as evidenced by BHP bidding $39 Billion for the 107 y/o London based mining company; Anglo American plc, who is a diamond, nickel, copper, and also the world’s largest platinum miner this past week.
WIA provides our clients with a unique mining stock option strategy that can provide monthly income in down, flat, or up markets. We propose to maximize this golden bull market with gains not with risky leverage, but with quality gold and silver miners using our covered option strategies. We can also advise you upon buying, owning, and safely holding your physical gold, silver, platinum, and palladium.
Give us a call to see how we can help you ride this golden bull market at 405-340-1717.
Womack Investment Advisers, Inc. (WIA) is a registered investment adviser whose principal office is located in Oklahoma. Womack Investment Advisers, Inc. is also registered in the State of California, the State of Illinois, the State of Indiana, and the State of Texas. WIA only transacts business in sates where it is properly registered, or excluded, or exempted from registration requirements.